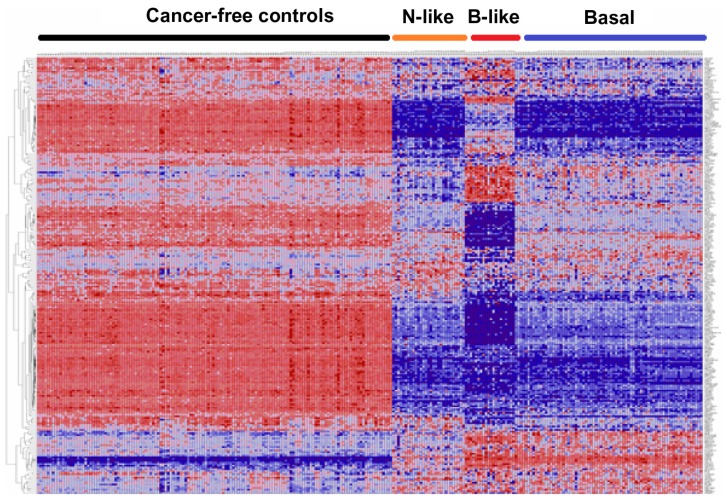
Figure 5.
Patterns and clusters of gene expression profiles for the 256 genes (159 SNP-containing genes and 97 novel genes not identified by GWAS, highly significantly associated with TNBC) in different subtypes of TNBC and controls.
Notes: Genes are represented in the roles and samples in the columns. Red and blues colors indicate up and down regulation, respectively.

