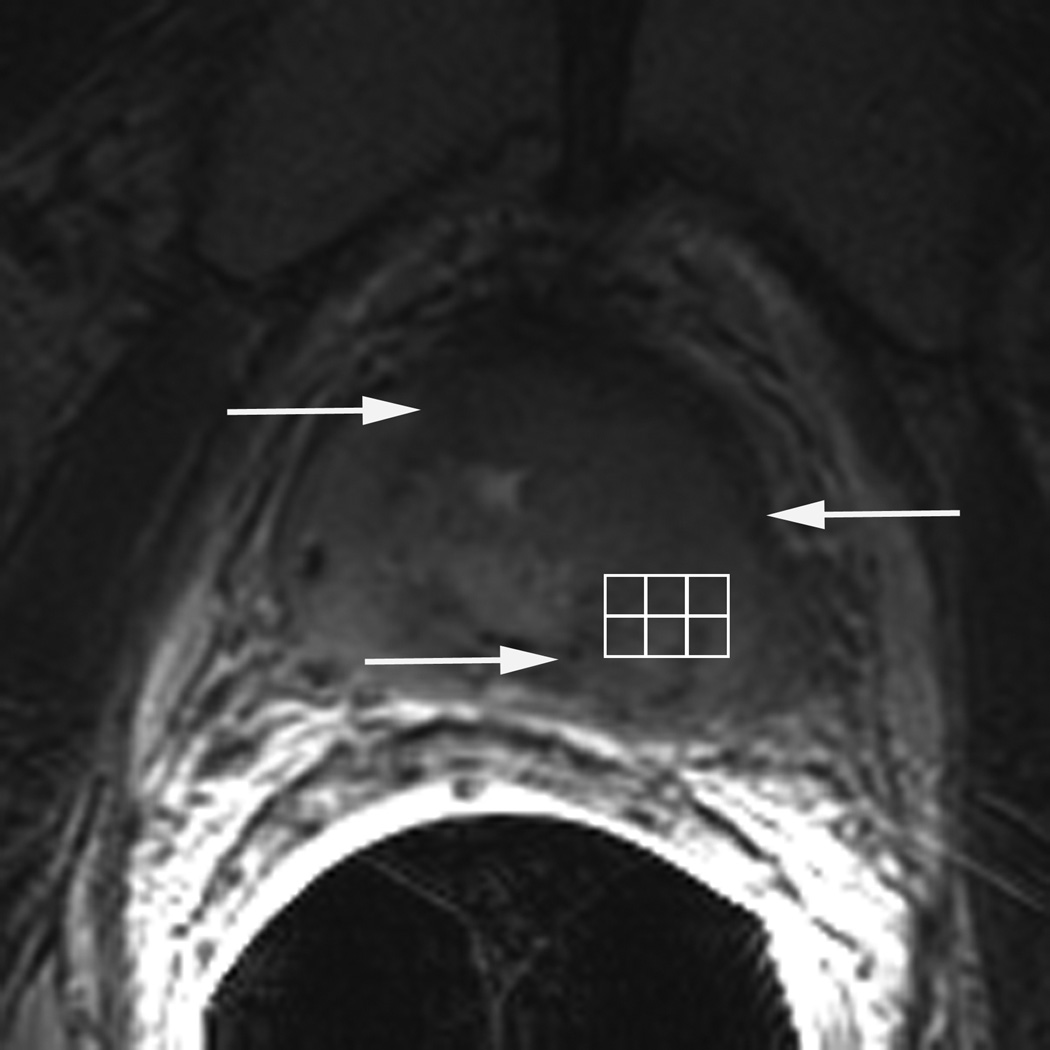
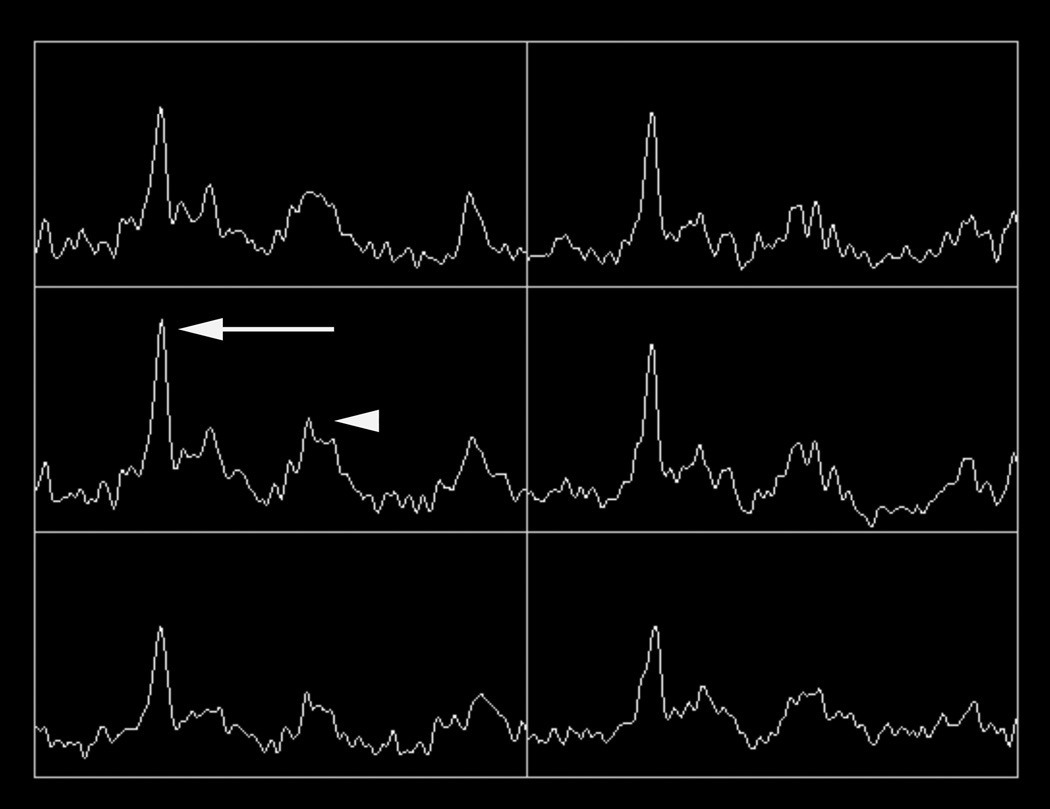
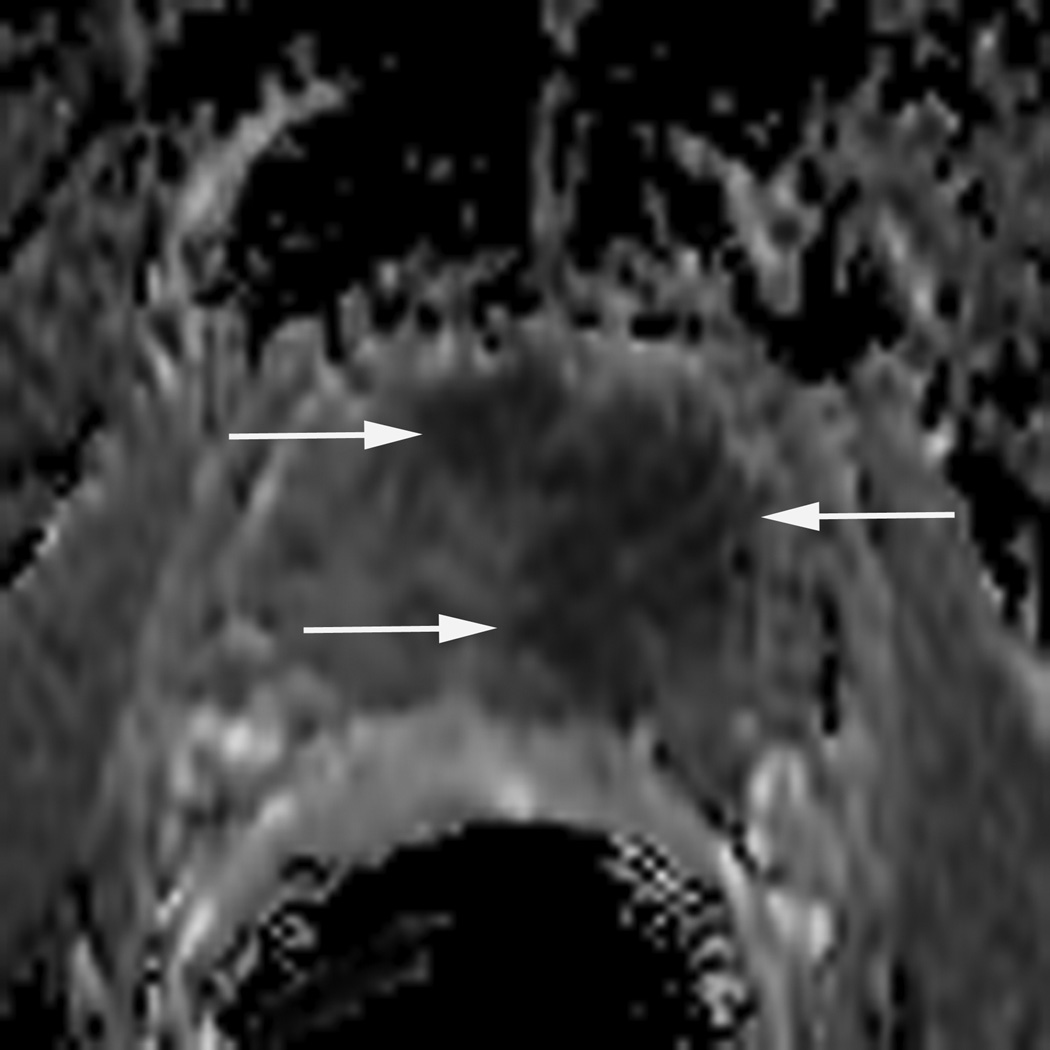
Figure 2.
77 year-old man with biopsy proven recurrent prostate cancer in the left gland. T2-weighted MR image demonstrates a large focal area of decreased signal intensity, consistent with recurrent cancer (arrows in A). Grid (in A) with corresponding MR spectra showing high choline (arrow in B) and low citrate peaks (arrowhead in B), characterizing malignant metabolism. ADC map demonstrates restricted diffusion in the same area (arrows in C).


