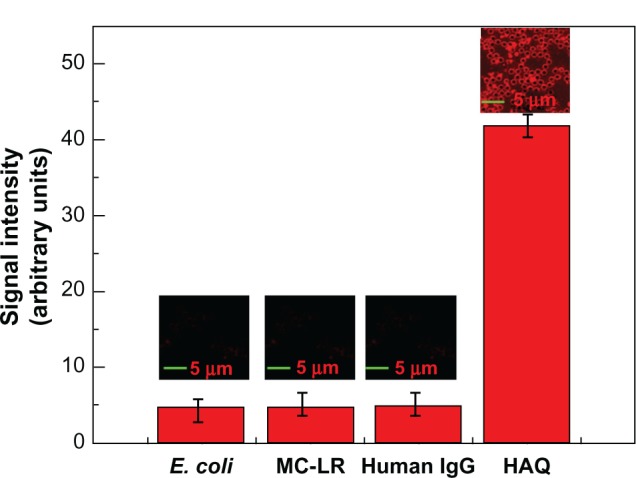
Figure 10.

Laser-scanning confocal microscopy images (the upper parts) and the corresponding signal intensity calculated by Image-pro plus 5.0 software (Media Cybernetics, Rockville, MD, USA) (the red columns).
Notes: From left to right in the figure are the image and response of anti-H5N1-conjugated microsphere reacted with the following analytes: Escherichia coli, microcystin-LR, human immunoglobulin G, and HAQ. Scale bars, 5 μm.
