Figure S3.

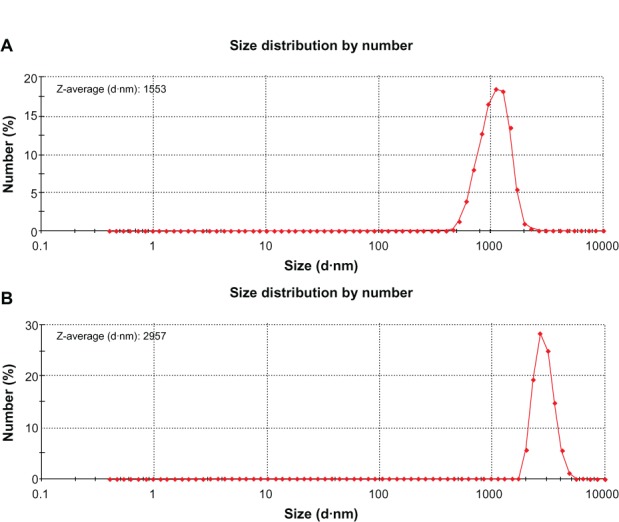
The size distribution of PS microspheres (A) and PS@PDAV microspheres (B) measured by using Zeta potential measurement.

The size distribution of PS microspheres (A) and PS@PDAV microspheres (B) measured by using Zeta potential measurement.