Figure S5.

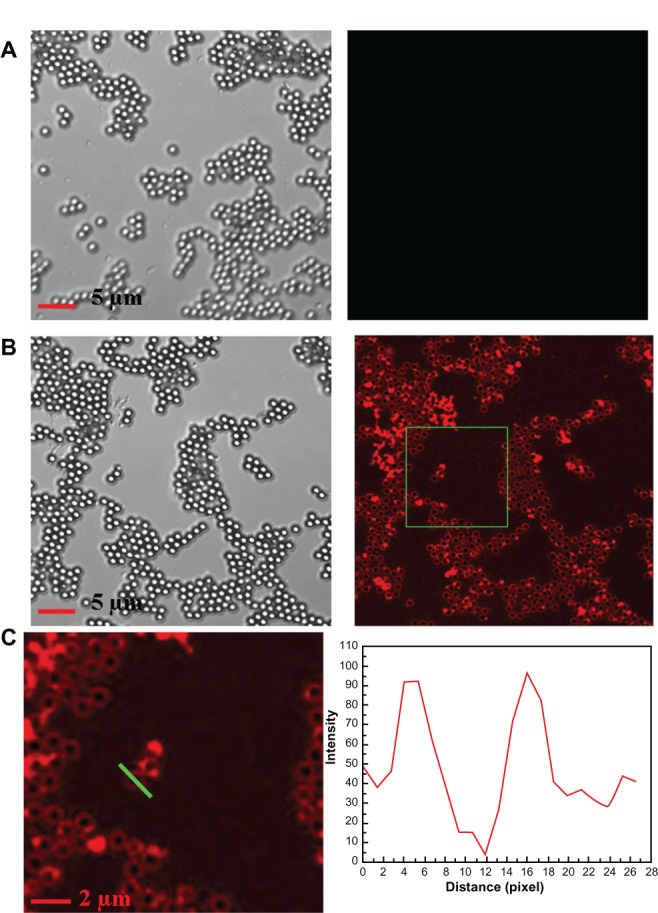
(A) LSCM images of blue PS@PDAV microspheres; (B) LSCM images of the red PS@PDAV microspheres; (C) Magnifed image of a part of (B) and fluorescence intensity distribution along the straight, green line.

(A) LSCM images of blue PS@PDAV microspheres; (B) LSCM images of the red PS@PDAV microspheres; (C) Magnifed image of a part of (B) and fluorescence intensity distribution along the straight, green line.