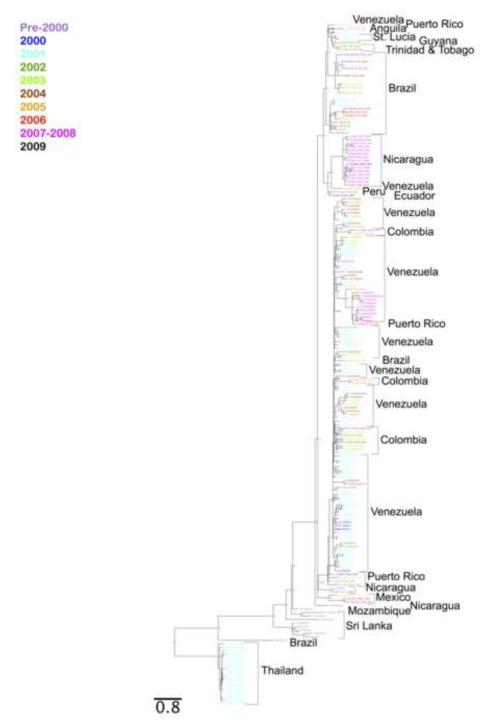
Figure 1. Whole Genome Bayesian Phylogenetic Tree.
A Bayesian phylogenetic tree reconstruction of DENV-3 whole genomes isolated from various times and places. Sequence names are color-coded to represent the time of isolation for each virus. The large topological separations correlate with the geographical location where each virus was isolated (indicated by black brackets and text). The smaller topological separations within any geographical clade appear to be dependent on the temporal point of viral isolation. Branch lengths are proportional to distance (the number of nucleotide substitutions per site), and the distance scale for the number of changes is provided at the bottom of the figure.

