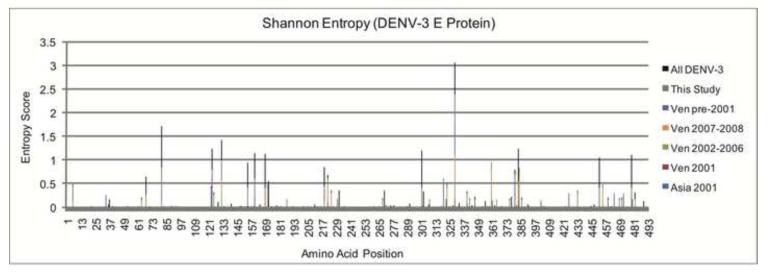
Figure 2. Histogram of the Shannon Entropy Calculated for the DENV-3 E Protein.
A stacked column graph showing the Shannon entropy scores calculated for each amino acid position in the DENV-3 E protein. Subsets of sequences were divided based on time and/or place of isolation as follows: Asian sequences from Thailand in 2001 (Asia 2001), Venezuelan sequences isolated before 2001 (Ven pre-2001), the first Venezuelan DENV-3 outbreak in 2001 (Ven 2001), 2002-2006 (Ven 2002-2006), the second Venezuelan DENV-3 outbreak in 2007-2008 (Ven 2007-2008), all new Venezuelan and Asian sequences characterized in the present study (This Study), and all DENV-3 sequences combined (All DENV-3). The height of each color within each peak represents the Shannon entropy for that sequence set alone at the specified position in the E protein. The height of each peak represents the amount of amino acid variability for each individual position in all sequence sets for the E mature protein. Any column that is conserved in the multiple sequence alignment will not have an entropy score. No consistent amino acid substitutions were found to exist between sequences from the two outbreaks.

