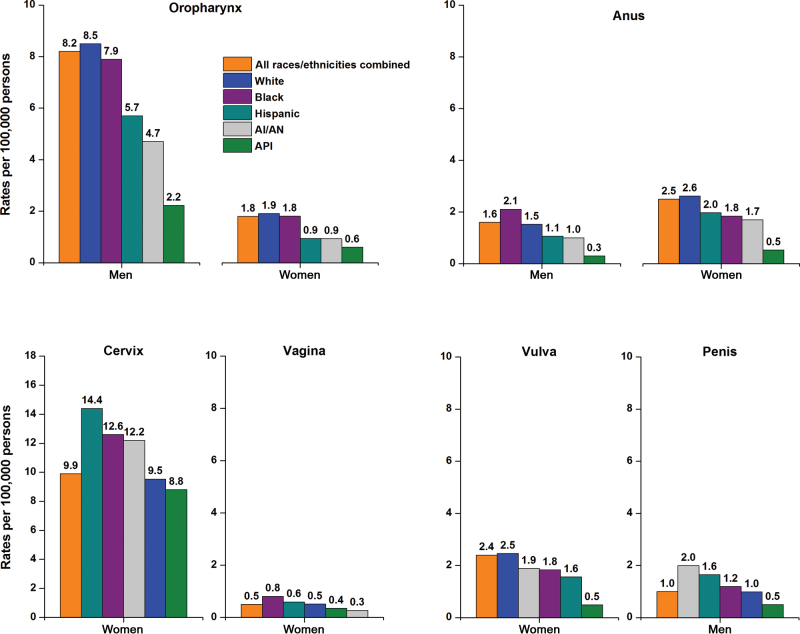
Figure 2.
Age-adjusted incidence rates for human papillomavirus (HPV)–associated cancers in the United States by sex and race and ethnicity, 2005 to 2009. The scale of the y axis differs for cervical cancer. The rates for the period from 2005 to 2009 for the five major racial and ethnic groups are from 47 states: Alabama, Alaska, Arizona, California, Colorado, Connecticut, Delaware, Florida, Georgia, Hawaii, Idaho, Illinois, Indiana, Iowa, Kansas, Kentucky, Louisiana, Maine, Maryland, Massachusetts, Michigan, Minnesota, Mississippi, Missouri, Montana, Nebraska, Nevada, New Hampshire, New Jersey, New Mexico, New York, North Carolina, North Dakota, Ohio, Oklahoma, Oregon, Pennsylvania, Rhode Island, South Carolina, South Dakota, Tennessee, Texas, Utah, Vermont, Washington, West Virginia, Wyoming. Source: National Program of Cancer Registries and Surveillance, Epidemiology, and End Results areas reported by the North American Association of Central Cancer Registries as meeting high-quality incidence data standards for the specified time period. HPV-associated cancers are defined as cancers at specific anatomic sites and with specific cellular types in which HPV DNA frequently is found. Some of these cancers may not necessarily be HPV-positive because no testing was conducted. White, black, Asian/Pacific Islander (API), and American Indian/Alaska Native (AI/AN) (IHS Contract Health Services Delivery Area counties) include Hispanic and non-Hispanic; the race and ethnicity categories are not mutually exclusive.

