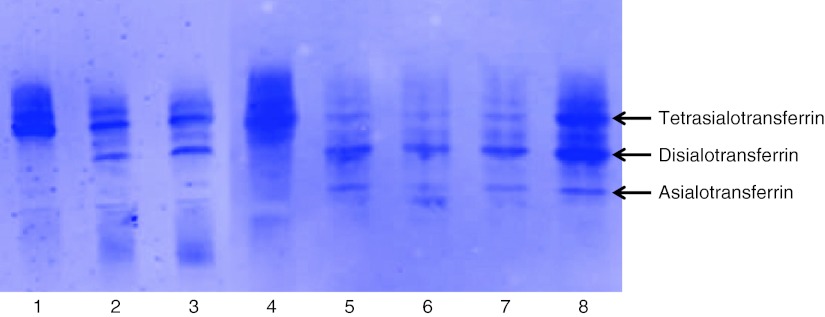
Fig. 1.
Lanes 1 and 4 represent control IEF transferrin patterns (the presence of tetratransferrin indicates a normal profile). Lane 2 indicates the IEF profile of patient 2 and lane 3 indicates the IEF profile of patient 4. Lanes 5, 6, and 7 represent the IEF profiles of patient 1. The IEF profiles were consecutively performed at 2 , 3 , and 4 months of age. Lane 8 represents the IEF profile of patient 3

