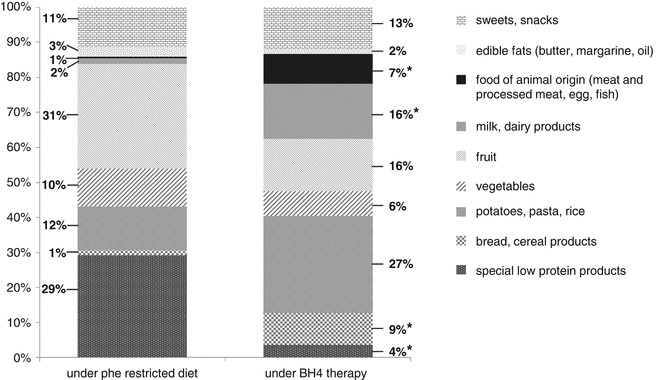
Fig. 2.

Food consumption of BH4-sensitive patients on classical dietary treatment (left bar) compared to BH4 therapy during follow-up (right bar). Shown are the shares of food groups (%) of total food consumption (*significant difference between period 1 and 4: bread (P = 0.022), dairy products (P = 0.002); potatoes, pasta and rice (P = 0.021), food of animal origin (meat, processed meat, fish, egg, P = 0.016); special low protein products (P = 0.009))
