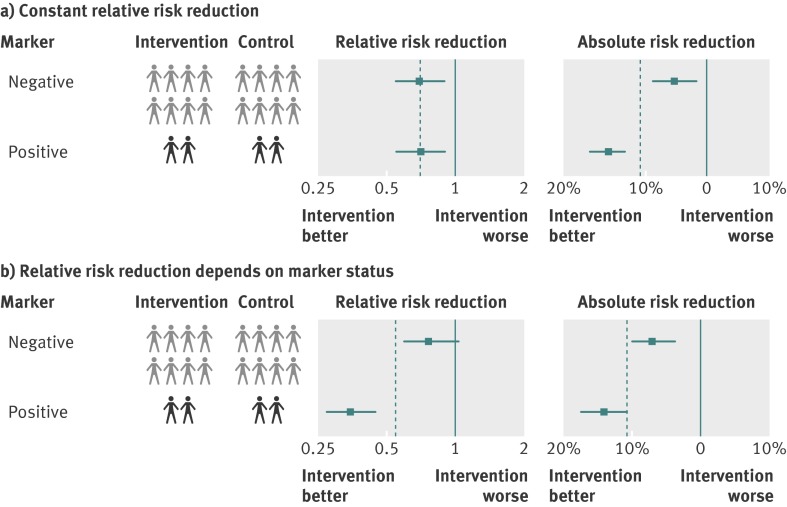
Fig 2 Estimated treatment effect in subgroups defined according to (upper panel) risk from a prognostic model and (lower panel) a factor that predicts differential treatment response. The prevalence of positive factor and high risk is shown, arbitrarily, as 20%. The dotted vertical line shows the overall treatment effect, the centre of each box shows the effect estimate, and the horizontal lines show confidence intervals

An official website of the United States government
Here's how you know
Official websites use .gov
A
.gov website belongs to an official
government organization in the United States.
Secure .gov websites use HTTPS
A lock (
) or https:// means you've safely
connected to the .gov website. Share sensitive
information only on official, secure websites.
