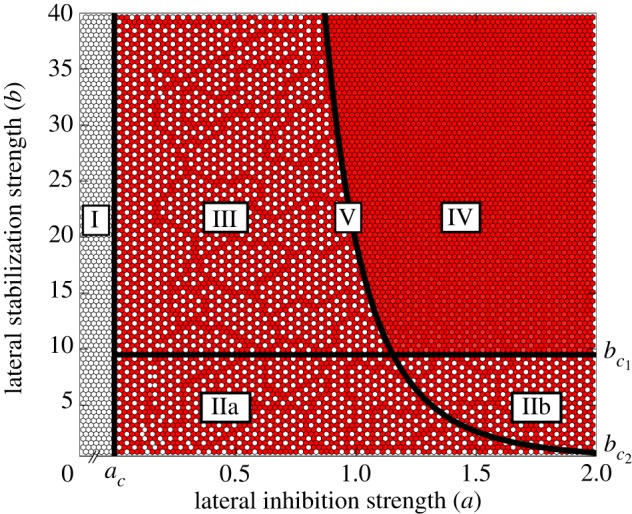
Figure 2.

Classification of different spatial pattern domains under varying strengths of lateral inhibition a and lateral stabilization b. Colour (dark/white) indicates (high/low) expression of Y. The Roman numerals (I–V) denote different patterning domains. Solid lines indicate phase transitions with critical values ac,  and
and  that are found by means of bifurcation analysis. Parameters as in table 1; a and b as indicated on axes. (Online version in colour.)
