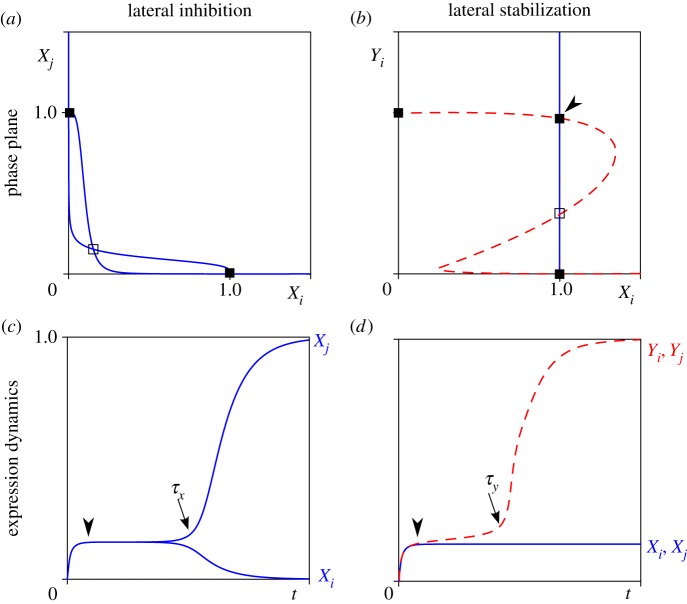
Figure 3.
Analysis of cell–cell interaction mechanisms in a system of two cells i and j. Phase plane analysis (a,b) and time plots of gene expression dynamics (c,d). (a) Nullclines of X (where dX/dt = 0) under lateral inhibition. One symmetric unstable steady state (open box) and two asymmetric stable steady states (filled boxes) coexist. (b) Nullclines of Xi (solid line) and Yi (dashed line) under lateral stabilization where Yj = 1. One unstable steady state (open box) and three stable steady states (filled boxes) exist. Arrowhead indicates a ‘new’ steady state dependent on lateral stabilization. (c) Symmetry breaking in X expression. After induction, a transient of intermediate expression at the symmetric unstable steady state (arrowhead) is followed by symmetry breaking (arrow, at t = τX) into one X+ and one X− cell. (d) Biphasic growth of Y in the deterministic system (η = 0 to exclude symmetry breaking of X). After induction, expression of Y remains at a plateau level (arrowhead) followed by super-induction (arrow, at t = τY) through lateral stabilization. Parameter values as in table 1. (Online version in colour.)

