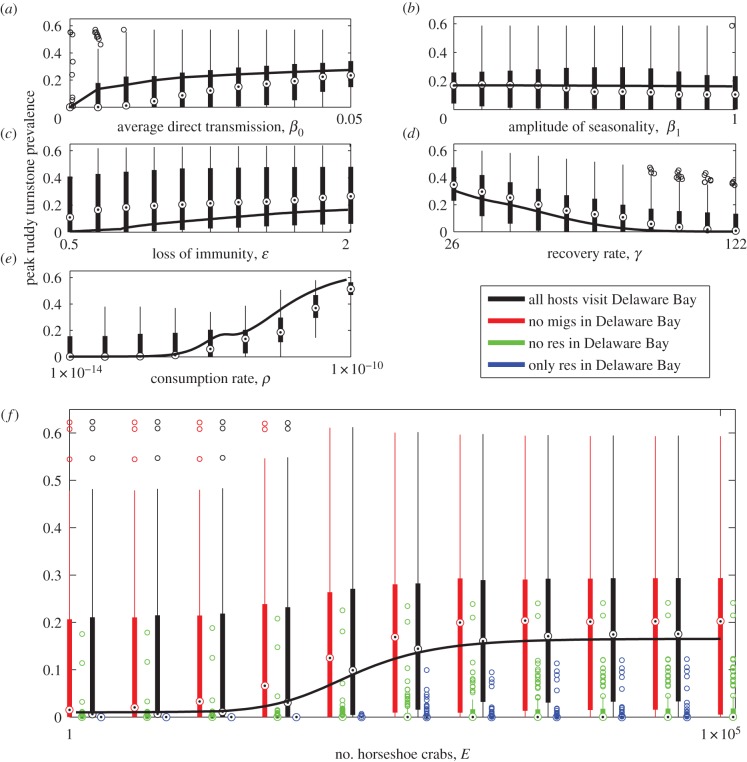
Figure 4.
Effects of parameter variation on peak AIV prevalence in ruddy turnstones in Delaware Bay, using Latin hypercube sampling (LHS) across key epidemiological parameters. Each panel shows the results of varying one of these parameters and maintaining all other parameters as given in table 1 (some exceptions are required—see the electronic supplementary material for details) as a black line. The LHS for each parameter is then shown as a boxplot. (a) The results as the direct transmission rate in ducks varies; (b) the results as the amplitude of seasonality in the ducks' direct transmission rate varies; (c) the results from varying the duration of immunity of ducks; (d) the results as the recovery rate varies in all three species; (e) the results if the consumption rate varies in all species; and (f) how peak prevalence varies as the number of horseshoe crabs is varied. The range for each of the parameters used in the LHS is given in the electronic supplementary material, table S1.

