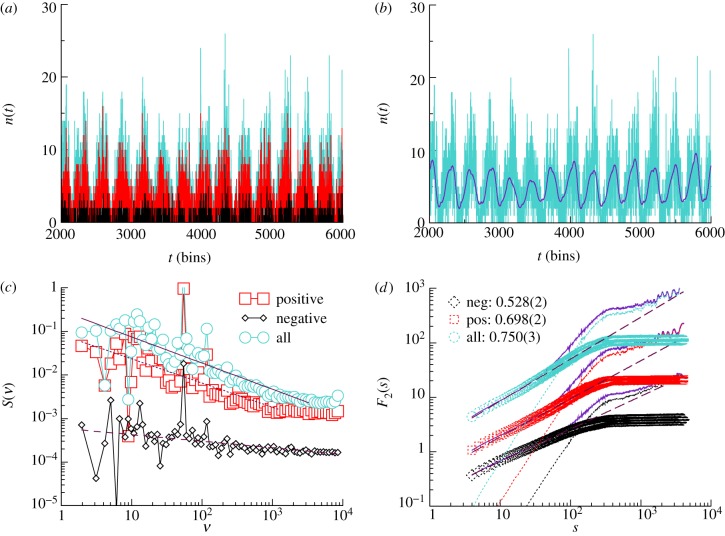
Figure 12.
(a) A part of the time series of the number of messages from MySpace dialogues for the two-months window: all messages (cyan), and the messages classified as carrying positive (red) and negative (black) emotion valence. The length of each time series is T = 16384 time bins (one bin corresponds to 5 min). (b) The local trend with the daily cycle (thick line) plotted over the original signal. (c,d) The power spectrum S(ν) of the time series and their dispersion F2(s): the original (full lines) and the corresponding detrended series (symbols) and the trends (dotted lines).

