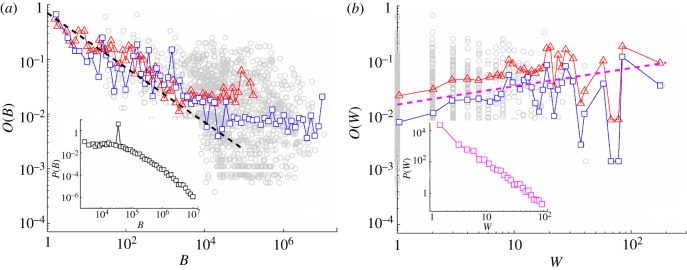
Figure 7.

The averaged overlap O plotted against (a) betweenness centrality B and (b) weight W, for the symmetrical links on MySpace dialogue network of two-months window (squares) and Net3321 (triangles). The dashed lines indicate the slopes  and
and  , conjectured in Szell & Thurner [14]. Insets: the distributions P(B) and P(W) for the network of two-months window. Data are logarithmically binned. (Online version in colour.)
