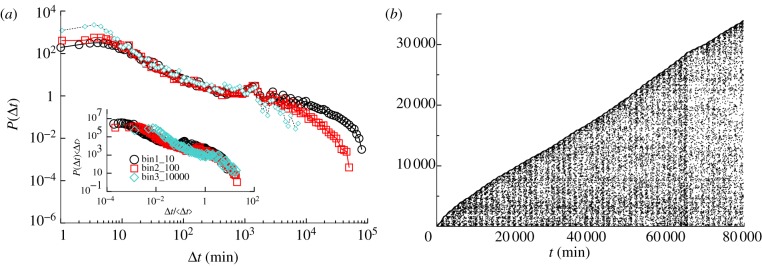
Figure 8.

(a) Distributions P(Δt,b) of the user delay time Δt for three activity bins. Inset: scaling plot of the distributions. Logarithmically binned data. (b) User-activity pattern in MySpace dialogues from two-months window. (Online version in colour.)
