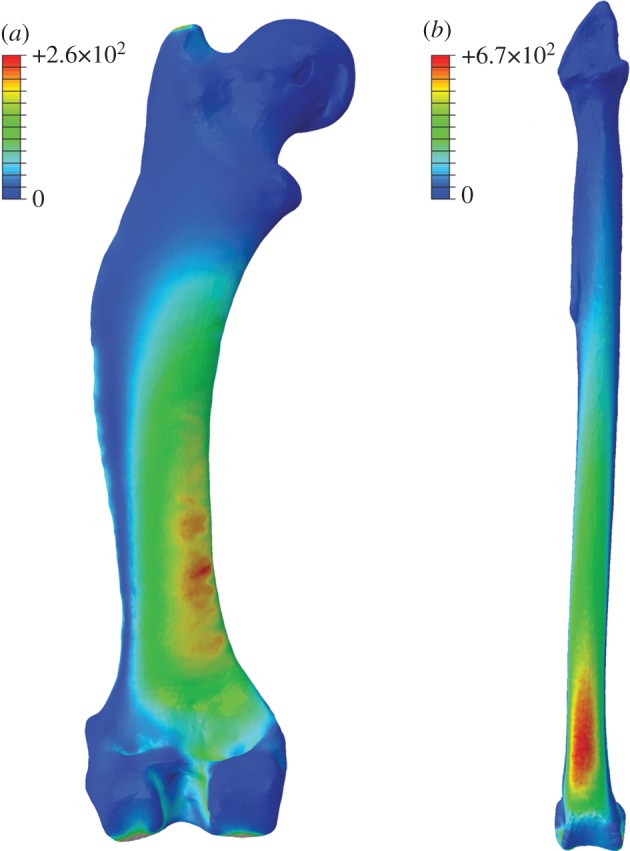
Figure 10.

Whole-bone distribution of Von Mises stress under bending loading regime. (a) Erinaceus femur. (b) Uria tibia. Values in legend reported in kilopascals (kPa). Note the regular increase in σvm towards the fixed end in the beam-like tibia of the guillemot. In contrast, note the uneven distribution of stresses in the hedgehog femur, probably owing to irregular geometry down-shaft and the occurrence of degree of torsion under bending. Loads applied are species-specific and correspond to 1% of body mass (table 1).
