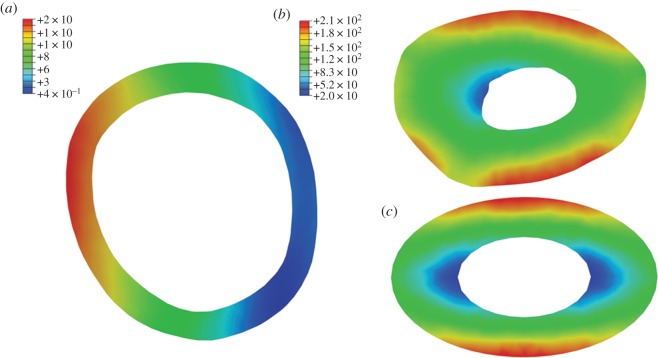
Figure 6.
(a) Distribution of Von Mises stress at midshaft of a flamingo (Phoenicopterus) femur under compressional loading. Induced bending is indicated by one cortex being placed in compression (low values of σvm), while the opposite cortex is in tension (high values of σvm). Value predicted by classic beam theory (approx. 7 kPa) lies between these cortices. Values in legend reported in kilopascals. (b) Distribution of σvm at midshaft of giraffe (Giraffa) tibia under torsion. Note the highest stress values occur where cortical wall thickness is at a minimum. (c) For comparative purposes, the distribution of σvm in a simple elliptical toroid under torsion. Loads applied in (a) and (b) are species-specific and correspond to 1% of body mass (table 1).

