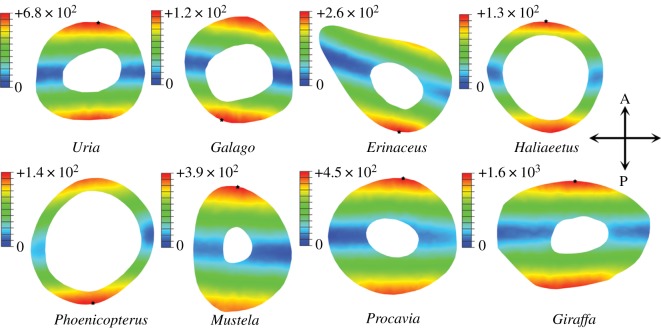
Figure 7.
Distribution of Von Mises stress at midshaft of diaphyses under bending. Values in legend reported in kilopascals (kPa). Star indicates location of maximum value of σvm. Lowest values of σvm (blue) indicate approximate position of neutral axis of bending. Loads applied are species-specific and correspond to 1% of body mass (table 1).

