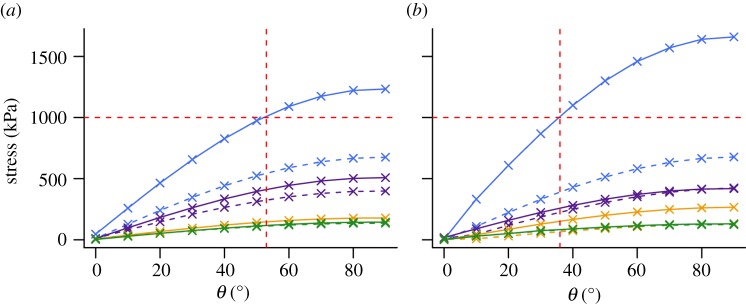
Figure 9.

Species curves of σcombined against bone orientation. (a) Stress values calculated according to classic beam theory. (b) Stress values extracted from midshaft of finite element models. Blue solid line, Giraffa; blue dashed line, Uria; purple solid line, Mustela; purple dashed line, Procavia; gold solid line, Erinaceus; gold dashed line, Phoenicopterus; green solid line, Galago; green dashed line, Haliaeetus. Horizontal red dashed line represents arbitrary value of 1000 kPa discussed in text. Vertical line represents intercept of horizontal line with stress curve of Giraffa, indicating maximum angle from vertical at which tibia may be held whilst not exceeding stress value of 1000 kPa. Loads applied are species-specific and correspond to 1% of body mass (table 1).
