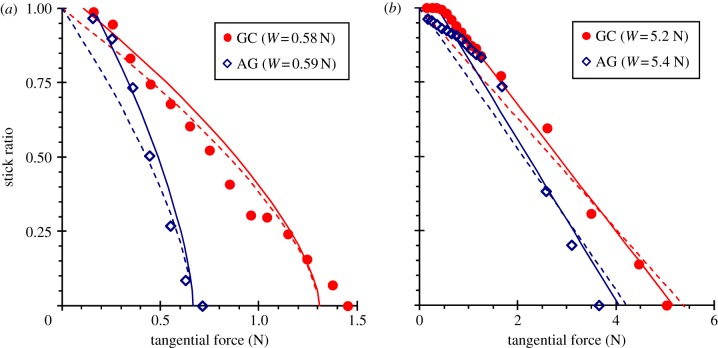
Figure 10.
The stick ratio as a function of the tangential force for two subjects with very different hydration levels (filled circles, GC wettest; unfilled diamonds, AG driest) and for two target normal forces: (a) 0.5 N and (b) 5 N. Each point corresponds to the mean of five trials for a given subject and normal force. The dashed and full lines are best fits to equations (4.3) and (4.4) and equations (4.7) and (4.8) for (a) and (b), respectively, using the values of the parameters given in table 2. The data are taken from fig. 6 in the study of André et al. [95]. (Online version in colour.)

