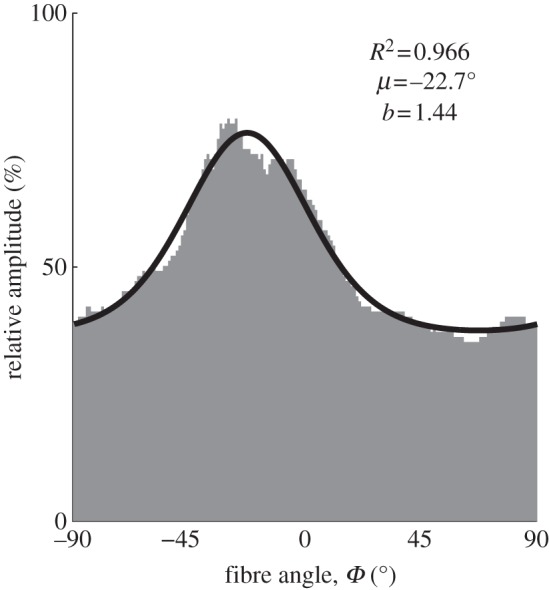
Figure 5.

Angular distribution of relative amplitudes fitted with a π-periodic von Mises distribution. The distribution was extracted from a single MPM image taken from the media featuring one fibre family (corresponding to the location at 634 µm in figure 4a). The angles Φ = 0° and 90° denote the circumferential and axial directions of the vessel, respectively. From the fit, we extracted the location parameter μ describing the preferred (or principal) fibre orientation and the concentration parameter b as a measure of the degree of fibre alignment about μ. An increase in b corresponds to a narrower (more anisotropic) distribution.
