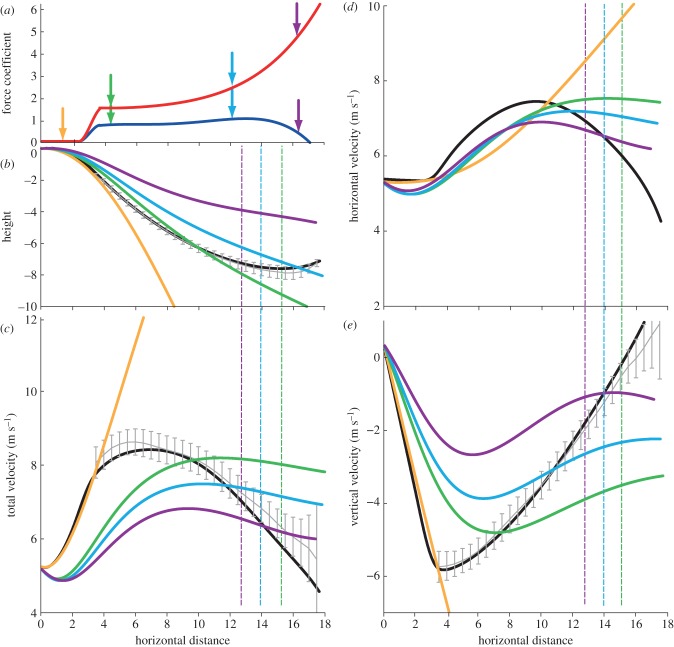
Figure 6.
Comparison of glide simulations. (a) Force coefficients used to generate the simulation that best matched the observed glides: CL, red; CD, blue. Before 3.5 m, CL and CD are constant and determined by an optimization scheme; after 3.7 m they are derived from observed glides. Coloured arrows highlight specific coefficients used in constant-coefficient simulations. These colours correspond to the line colours used in the remaining panels, such that the coefficients highlighted with the purple circles in (a) were used to create the simulations illustrated by the purple lines in (b) through (e). In (b) through (e), the black line represents the best-matched simulation, and the grey lines with error bars represent the observed data. The best-matched simulation and observed data are similar but not identical because the simulation is based on a polynomial fit rather than the original data. Dashed lines represent distance where equilibrium conditions are met. (b) Comparison of two-dimensional trajectories of simulations with different constant force coefficients, (c) comparison of total velocity of simulations, (d) comparison of horizontal velocities of simulations and (e) comparison of vertical velocity of simulations. (Online version in colour.)

