
Figure 7.
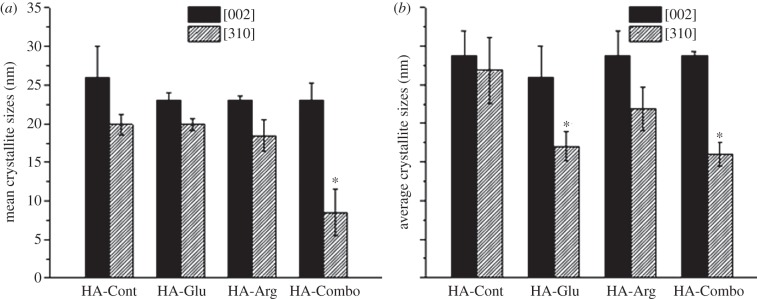
(a) Average crystallite sizes along [002] and [310] measured by XRD for HA-Cont, HA-Arg, HA-Glu and HA-Combo at the precipitation time and (b) after 2 days. Asterisks indicate samples that were significantly different from HA-Cont (p < 0.05 in (a) and p < 0.08 in (b)).