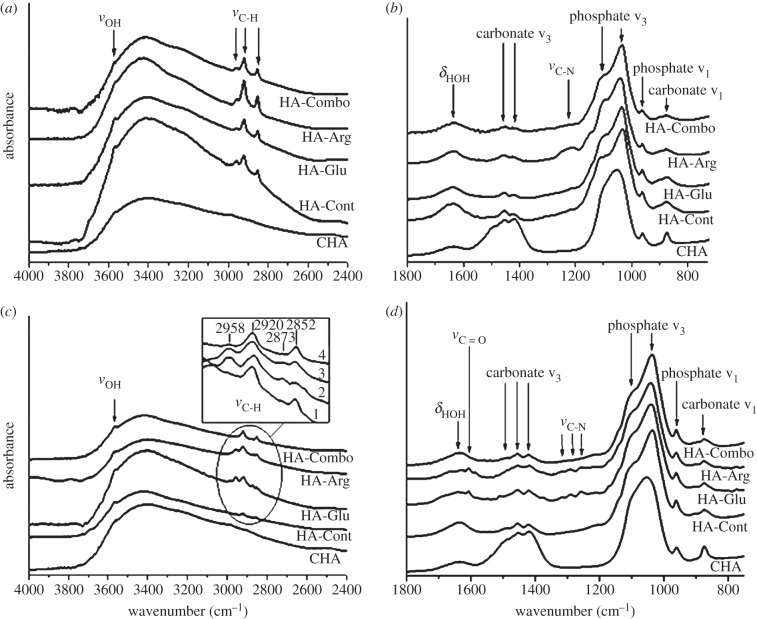
Figure 8.
IR spectra of control and AAs samples at precipitation time (a,b) and after 2 days (c,d). All spectra are normalized with respect to the main phosphate peak of CHA at 1055 cm−1. Spectra are then translated along the y-axis for clarity. Sections (a,c): 4000–2400 cm−1 region; (b,d): 750–2000 cm−1 region. Inset in section c: zoom-in of 3000–2800 cm−1 region for spectra HA-Cont (1), HA-Glu (2), HA-Arg (3) and HA-Combo (4).

