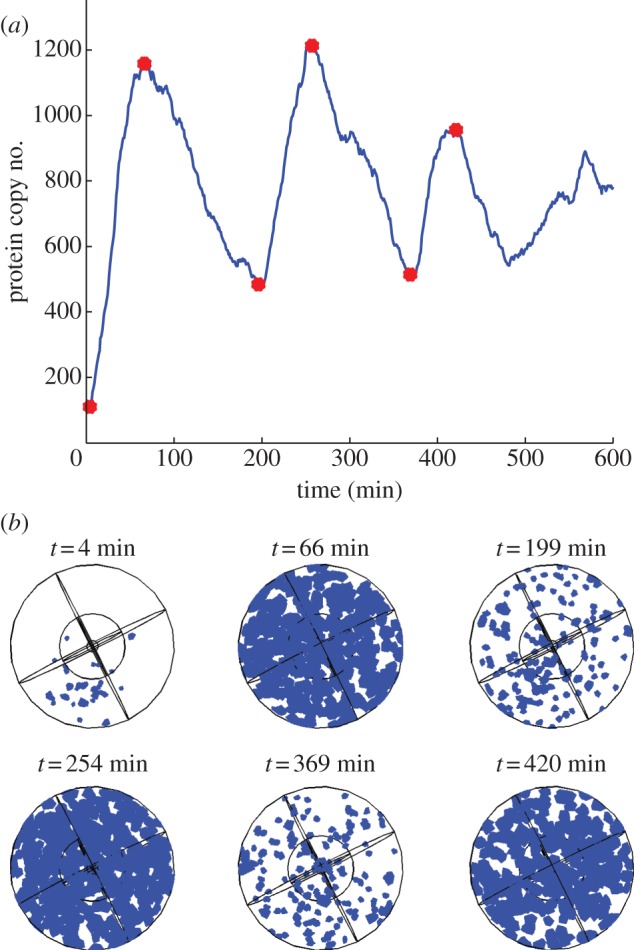
Figure 5.

(a) Plot showing the total Hes1 protein copy number over a period of 600 min from a single trajectory of the Hes1 model (see table 1 of the main paper for parameter values), and (b) plots showing the corresponding spatial distributions of Hes1 protein. The times for these spatial snapshots were chosen to correspond to the peaks and troughs of oscillations in Hes1 protein copy number shown in (a) above. These times are highlighted by the red circles in (a). In (b) blue voxels indicate regions of the cell which contain Hes1 protein.
