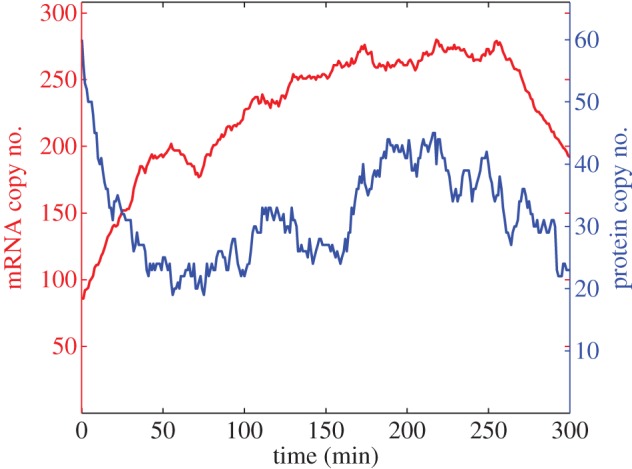
Figure 7.

A single trajectory from a translation inhibition numerical experiment. The total numbers of hes1 mRNA (red) and Hes1 protein (blue) are plotted against time. Baseline parameter values are used with the exception of αp which is reduced by a factor 100.
