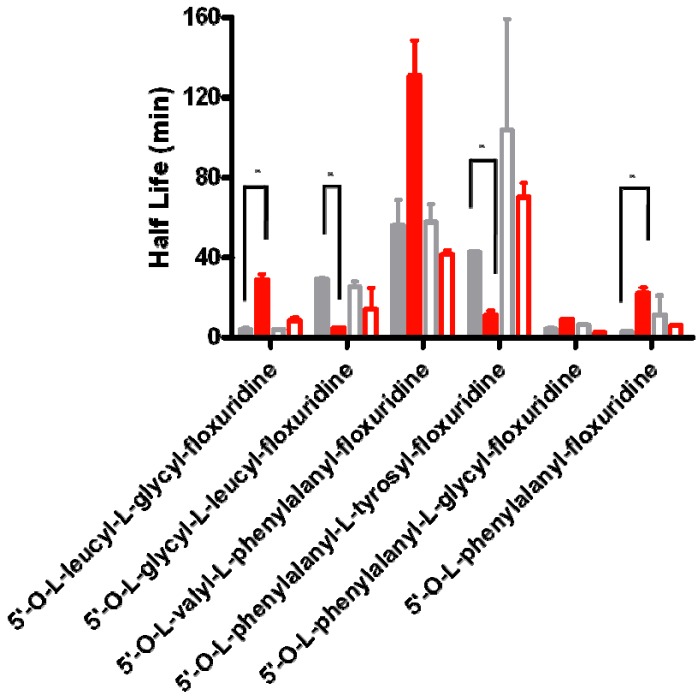
Figure 2.
The difference of prodrug stability in the cytosolic fraction of cell homogenate and in whole cell homogenate of Capan-2 and Caco-2 cells. Gray bars represent the prodrug stability in whole cell homogenate and red bars represent the prodrug stability in the cytosolic fraction of cell homogenate. Closed bars represent the prodrug stability in Capan-2 cells and open bars represent the prodrug stability in Caco-2 cells. Values presented are the mean ± s.d., n = 4, (* p < 0.01; t-test).

