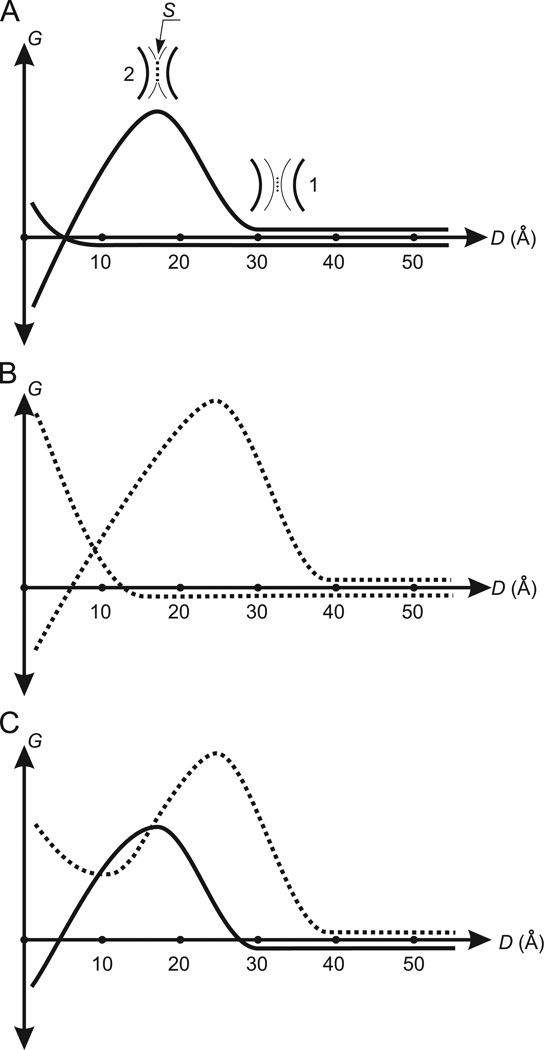
Fig. 1.
Changes of the free energy during the coming together of spherical molecules in water: (A) the coming together of non-polar spherical molecules. G is the free energy. D is the distance between the surfaces of molecules. The curve forming the energy barrier is the free energy Gw. The other curve is the free energy Gm. 1 is one layer of water molecules (dots) clamped between the hydration shells (fine arcs). The black bold arcs are the surfaces of molecules. The clamped water molecules determine the beginning of the increase of Gw. 2 is the surface–surface contact (the broken line S) formed by the hydration shells. An area of S determines the maximum value of Gw. (A) Demonstrates a case when the driving force for molecular association (decreasing Gw) successfully withstands the counteracting force (increasing Gm). (B) The curves Gw and Gm (broken) describing the coming together of spherical molecules having the surface enriched by polar atoms. In comparison with the curves Gw and Gm for non-polar molecules in (A), the energy barrier in Gw and the beginning of the increase of Gm are shifted to the right. The height of the energy barrier in Gw is increased. (C) The total curve for Gw and Gm (the Gmw-potential). The broken and unbroken curves are the Gmw-potentials for molecules having the surface enriched by polar atoms and for non-polar molecules, respectively.

