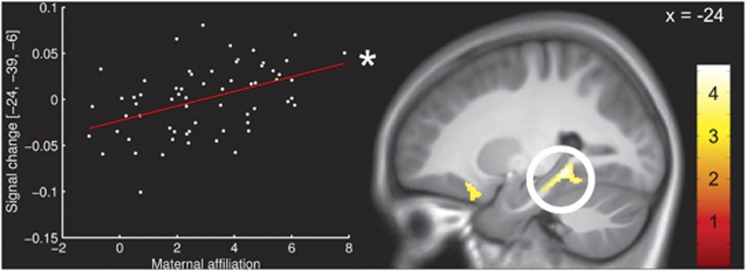
Figure 2.
Associations between maternal interpersonal affiliation according to the Inventory of Interpersonal Problems43 and gray matter density in the hippocampus. The scatterplot represents individual maternal affiliation scores and intensity values at the peak voxel in the hippocampus. The color bar indicates t-values. The activations are displayed at a threshold of P<0.001, uncorrected, for visualization purposes. *Significant at P<0.05, corrected.

