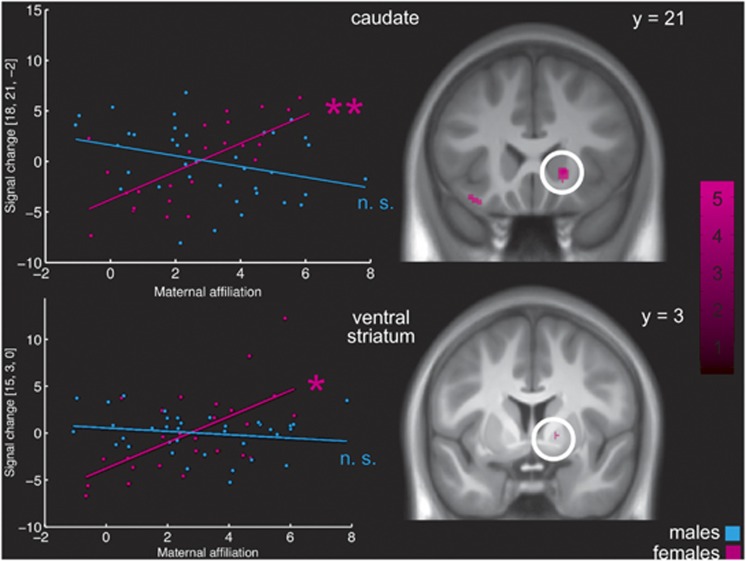
Figure 3.
Gender-specific association between maternal interpersonal affiliation according to the Inventory of Interpersonal Problems43 and striatal activation in the Monetary Incentive Delay task49—feedback of large rewards. The scatterplot represents individual maternal affiliation scores and intensity values at the peak voxel in the caudate (upper part) and the ventral striatum (lower part). Blue dots represent values of males, pink dots represent values of females. The activation maps show the activation associated with maternal affiliation in the female subgroup. The color bar indicates t-values. The activations are displayed at a threshold of P<0.001, uncorrected, for visualization purposes. **Significant at P<.01; *significant at P<0.05, all corrected; NS, non-significant.

