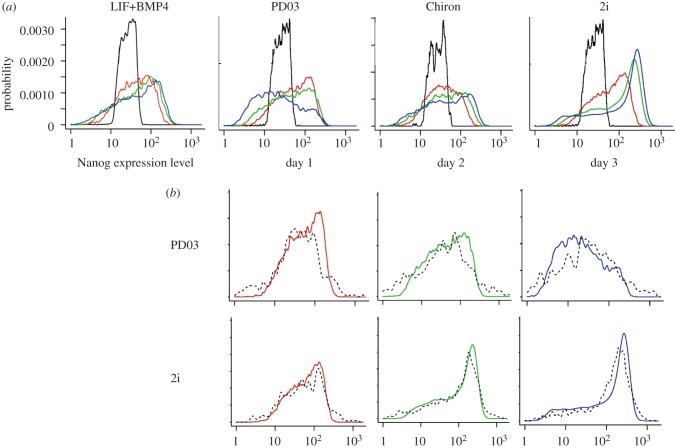
Figure 5.
Nanog expression distribution in the middle Nanog (MN) fraction of sorted ES cells. Sorted cells from the MN fraction were plated from LIF+BMP4 into media containing either PD03, Chiron or 2i, or LIF+BMP4 (for details, see §2). (a) Experimental data (days 0–3) of ES cells cultured in LIF+BMP4, PD03, Chiron and 2i. (b) Distributions of observed Nanog expression levels (solid lines) and predicted levels (dashed lines) sampled from the fitted theoretical model for PD03 and 2i. Black line, day 0; red line, day 1; green line, day 2; blue line, day 3.

