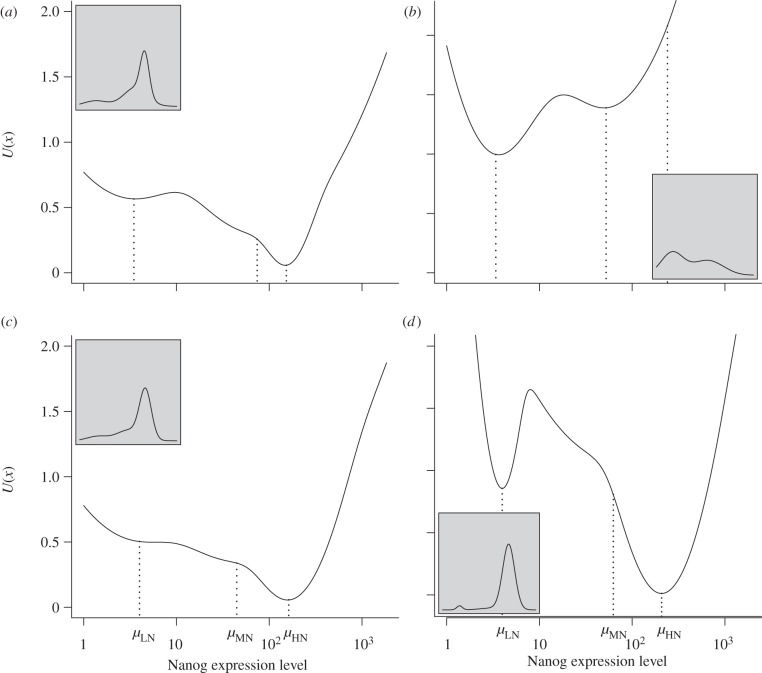
Figure 6.
Predicted stationary distributions of Nanog expression levels in different culture conditions. The figure shows the potential landscape of Nanog expression level in different culture conditions using the fitted models (table 2). The distribution associated with each potential and noise is shown in the smaller panel for each figure. The positions of the inferred centres of the three mixture components for each condition are indicated as μLN, μMN and μHN. (a) LIF+BMP4; (b) PD03; (c) Chiron; (d) 2i.

