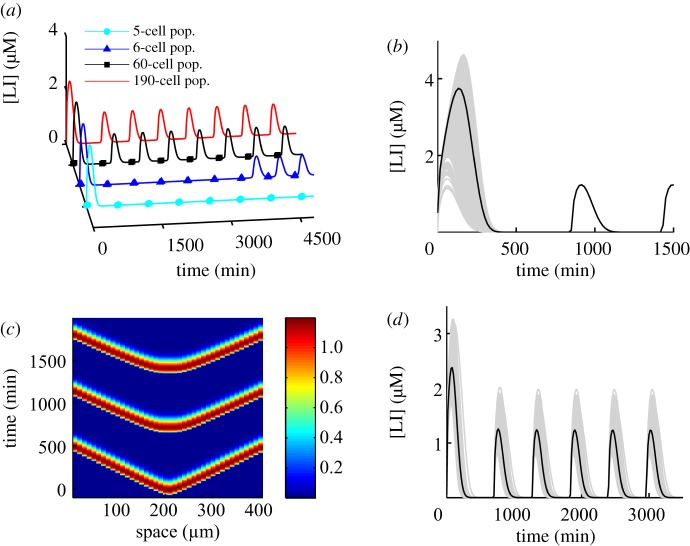
Figure 6.
How the population affects oscillatory behaviour in large-scale BSim simulations. (a) A plot of perfectly synchronized cells part of a population. Population sizes are indicated in the legend. An increasing population brings about onset of oscillations earlier owing to earlier accumulation of sufficient external AHL concentration. Cells are in a 200 × 50 × 1 µm3 chamber. (b) A population of 1139 cells with different initial conditions in a 200 × 50 × 1 µm3 chamber synchronized in the first few minutes of the simulation and then oscillated in-phase. Time series of individual cells are plotted for the entire population in grey. The black line indicates the population average. (c) A space–time plot illustrating a row of identical cells (part of a 1200 strong population) in the middle of a 400 × 300 × 1 µm3 chamber with DÃ = 0.009. The plot illustrates wave propagation through the chamber as cells become fully active sequentially in a neighbour-to-neighbour fashion. The gradient key illustrates the value of the variable [LI] in micromolar. (d) Time series illustrating synchrony of a heterogeneous population of 1139 cells in a 200 × 50 × 1 µm3 chamber. Time series of individual cells are plotted for the entire population in grey. The black line indicates the population average. Heterogeneity was introduced by modifying parameter values (production and degradation rates), using a Gaussian distribution with 5% standard deviation around the mean value of each parameter.

