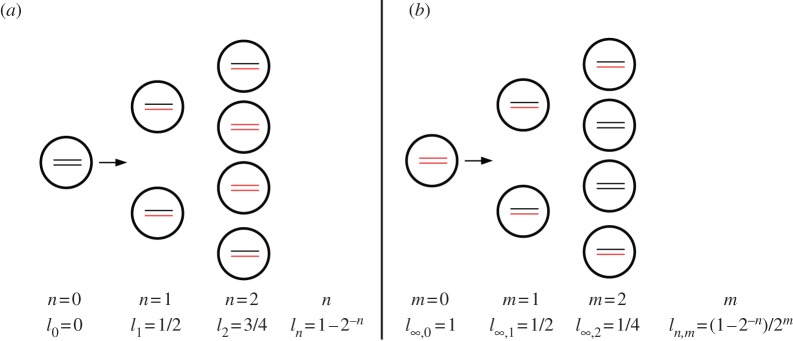
Figure 1.

Distribution of labelled DNA strands in cells (a) during BrdU labelling and (b) during de-labelling phases. Under the assumption of 100% labelling efficacy, after one division in the labelling phase, cells will have half of their DNA strands labelled, l1 = 1/2 (in cartoon, labelled strands are shown in red and unlabelled strands are shown in black). After two divisions, this is an average of l2 = 3/4 strands, and so on. Let ln,m denote the fraction of labelled strands in a cell having completed n divisions during the labelling phase, and m divisions during the de-labelling phase. During the de-labelling phase, a cell having all DNA strands labelled, for example  , divides into daughter cells having
  labelled strands, and so on. The BrdU fluorescence of a cell is an increasing function of l and cells will be classified as BrdU− when
  . For
. For  the division of unlabelled cells during labelling results in two BrdU-labelled cells. If at the end of the labelling phase a cell has a BrdU content
  , two divisions are required to make progeny of this cell to become BrdU− during de-labelling for the level of detection
  . If the detection limit were set at
  , this would take three divisions.
