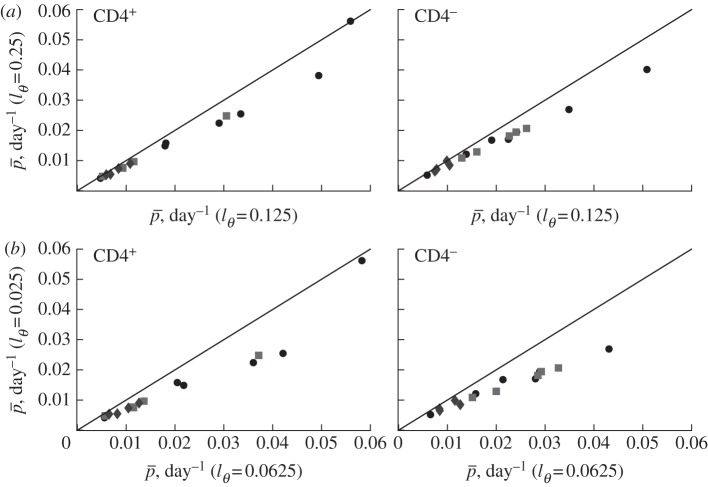
Figure 5.
The effect of the detection limit  on the estimate of the average turnover rate,
  , when fitting the BrdU labelling data of memory T cells in uninfected and SIV-infected rhesus macaques [13]. We consider three threshold levels,
  , 0.125 or 0.25, corresponding to the 4, 3 or 2 divisions, respectively, that a BrdU+ cell must undergo to result in BrdU− progeny. Diamonds denote uninfected monkeys, squares denote SIV-infected monkeys with a low viral load, and circles denote monkeys with a high viral load in the study of Mohri et al. [13]. This analysis illustrates that the estimate of the average turnover rate depends on
  but not strongly.

