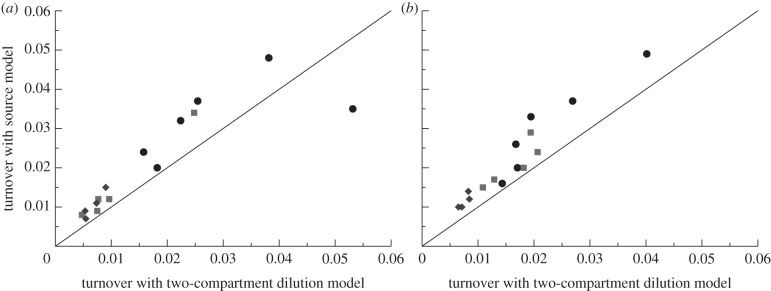
Figure 6.

Comparing the average turnover rates as estimated by the dilution model of equation (2.8) for  with those of the source model [27]. (a) CD4+ memory T cells and (b) CD4− memory T cells. The source model has higher estimates for the average turnover rates but the differences tend to remain fairly small. Diamonds denote uninfected monkeys (U), squares SIV-infected monkeys with a low viral load (L), and circles monkeys with a high viral load (H) in the study of Mohri et al. [13]. Monkey H1292 was not fitted by De Boer et al. [27] and is absent from this figure.
