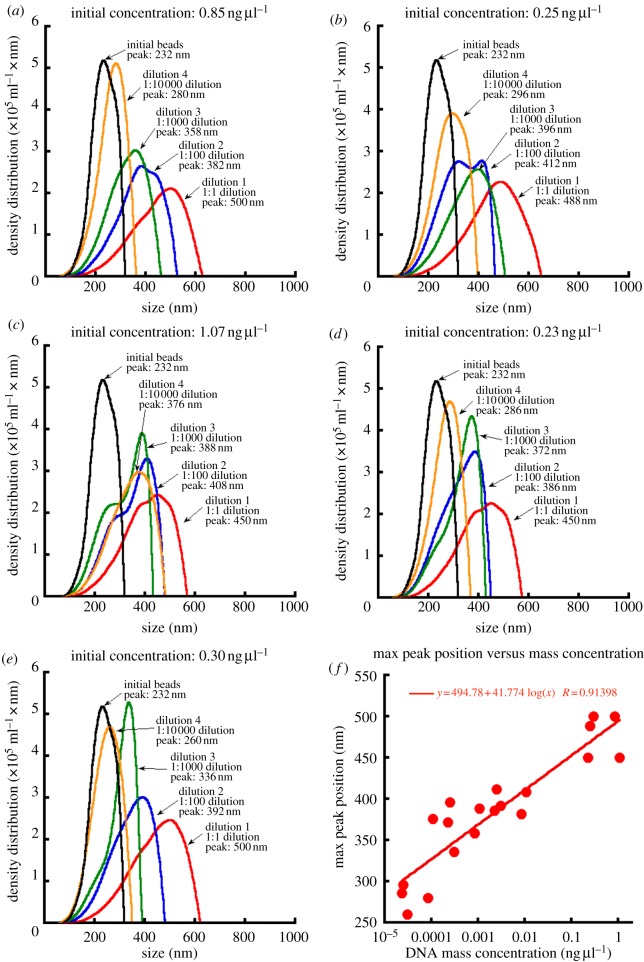
Figure 2.
Dilution curves produced from five individual quagga mussels to elucidate limits for LTS-bead-based detection from PCR product for quagga mussel. Data from (a–e) were then used to plot the correlation of peak position to sample concentration (f). For each sample (n = 5), five dilution screenings were conducted: control (no quagga PCR product), 1 : 1 dilution, 1 : 100 dilution, 1 : 1000 dilution and 1 : 10 000 dilution.

