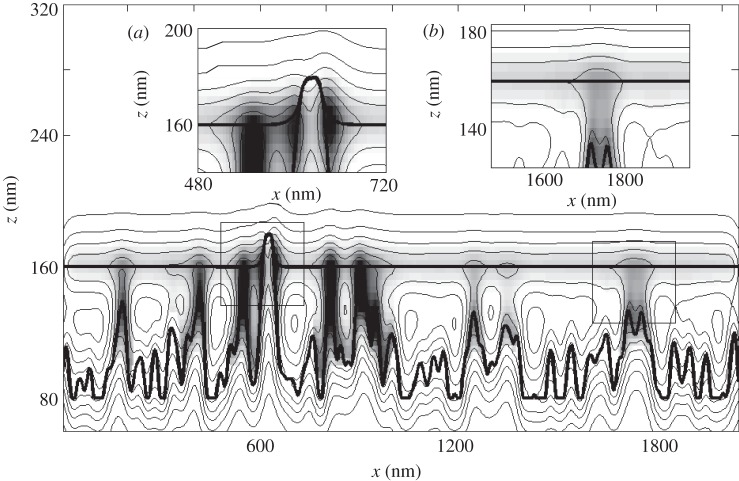
Figure 2.
Conceptual scheme of the numerical experiment. Two potential minima which correspond to the surfaces modelling elastic setae (upper surface) and rough substrate (down surface) are shown by thick lines. Potential relief is presented by the thin lines of the contour plot. Fluid density (liquid layer thickness) is shown as a greyscale map. Darker colour corresponds to higher density. Two different meniscus types, described in the text, are shown in insets (a) and (b).

