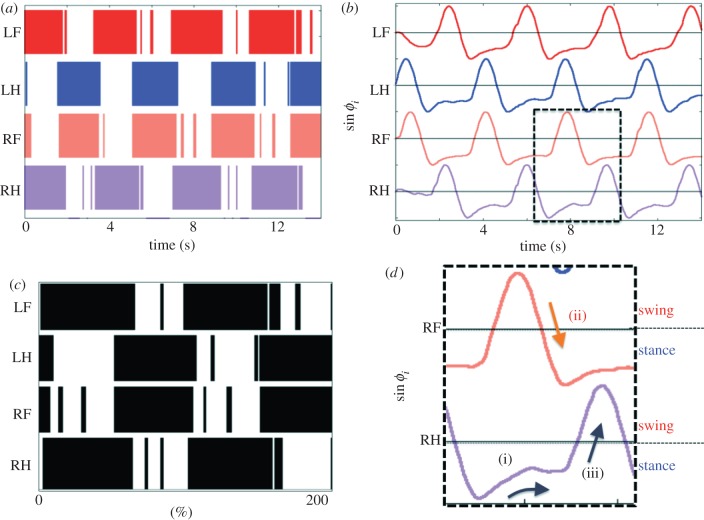
Figure 3.
Experimental results of steady walking motion: (a) the gait diagram during 0.0–14.0 s, (b) corresponding phases sin ϕi, and (c) gait diagram over two cycles from 6.9 to 13.2 s in (b). (d) A magnified version of the region marked with dotted lines in (b) shows the physical effect of local force feedback. (Online version in colour.)

