
Figure 6.
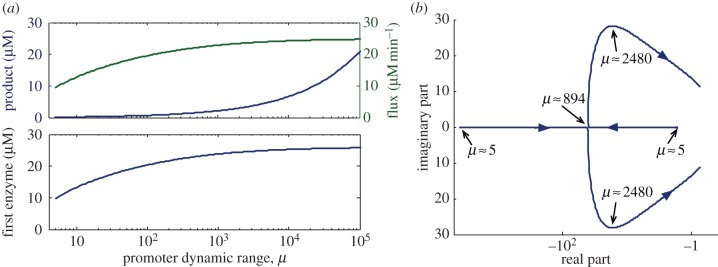
Impact of the promoter dynamic range on the metabolic steady state and the modes of the feedback system. (a) Steady-state value of the metabolic flux, and the concentrations of the product and the first enzyme. (b) Location of the promoter-dependent eigenvalues λprom. The plots were generated by solving the steady-state equation (3.2) (a) and computing λprom from (3.13) (b) for a different dynamic range μ spanning five orders of magnitude and a fixed tightness κ0. The real and imaginary parts in (b) are normalized to the degradation rate γ. We considered a pathway with two metabolites and two enzymes with Michaelis–Menten kinetics (gi(si−1) = kcat i
si−1/(KM i + si−1)) with kcat i = 32s−1 and KM i = 4.7 µM. These are representative values for PRA isomerase (extracted from the BRENDA database [29], EC number 5.3.1.24), a transcriptionally regulated enzyme in the tryptophan pathway of E. coli. We took the enzyme degradation rate as 2 × 10⁻⁴ s−1 (half-life  h), and used a substrate concentration s0 = KM1 (so that g1(s0) is at half-saturation). We modelled the product consumption as a Michaelis–Menten function d(sn) = dmaxsn/(Kd + sn) with dmax = 24.96 µM min−1 and Kd = 0.2 µM, both taken from an experimentally validated model for the tryptophan pathway [20]. Promoter tightness was fixed to κ0 = 0.03 nM min−1 and the RBS strength to b1 = 1, whereas the repression function was described by a Hill function σ(sn) = θh/(θh + snh) with Hill coefficient h = 2 and repression threshold θ = Kd. (Online version in colour.)