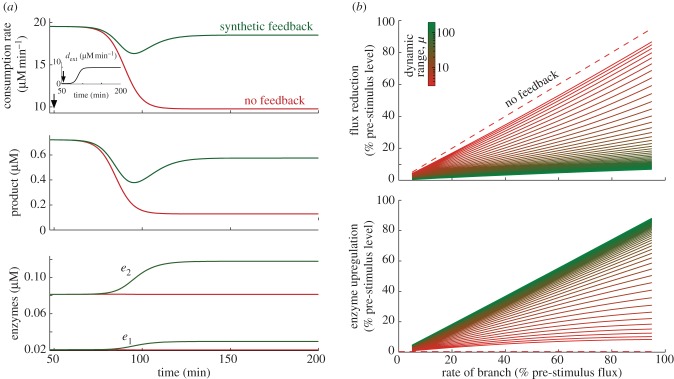
Figure 9.
Response of a synthetic operon to flux perturbations induced by engineered pathways. (a) Comparison between the dynamic responses of the synthetic control circuit and the uncontrolled case; the flux perturbation was induced at t = 50 min, and modelled as an S-shaped increasing rate consuming the intermediate s1, reaching 50% of the pre-stimulus flux in  h (see the inset). (b) Flux reduction and enzyme upregulation relative to the pre-stimulus levels as a function of the consumption rate in the branch and the promoter dynamic range. The uncontrolled case (μ = 1) is represented by the dashed lines. As in figure 7, in (a) we chose a promoter with dynamic range μ = 100 and RBS strengths bi = {1,4}, whereas in (b) we swept μ between 3 and 200 by changing the promoter strength. All the remaining network parameters are the same as in figure 6. (Online version in colour.)

