Figure 4.
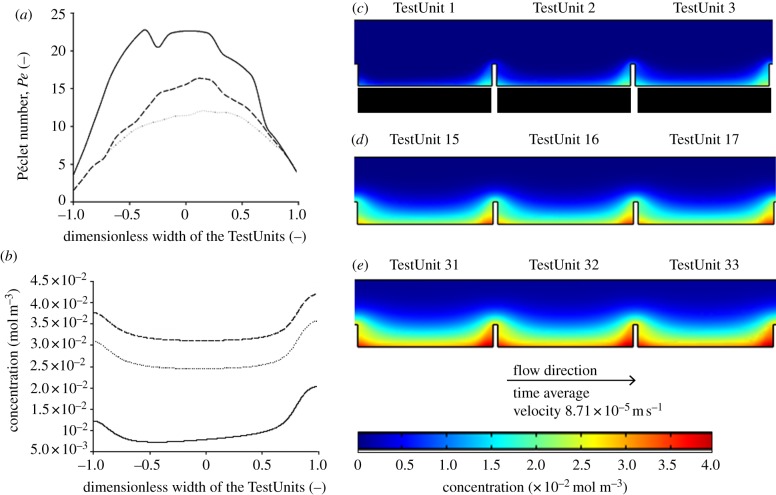
Péclet number profile and concentration profile of lactate. The concentration (in mol m−3) profile of lactate on the chip was modelled by CFD. (a) Péclet number (Pe) across the width of the TestUnit 1 (solid line), 16 (dashed line) and 33 (dotted line), at a distance of 10 µm above the bottom of the TestUnits. (b) Concentration profile in mol m–3 across the width of the TestUnit 1 (solid line), 16 (dashed line) and 33 (dotted line), at a distance of 10 µm above the bottom of the TestUnits. (c–e) Concentration profiles of representative sections of the chip. (c) TestUnits 1–3 representing initial part of the chip. (d) TestUnit. 15–17 representing the middle part of the chip. (e) TestUnits 31–33 representing the last part of the chip.

