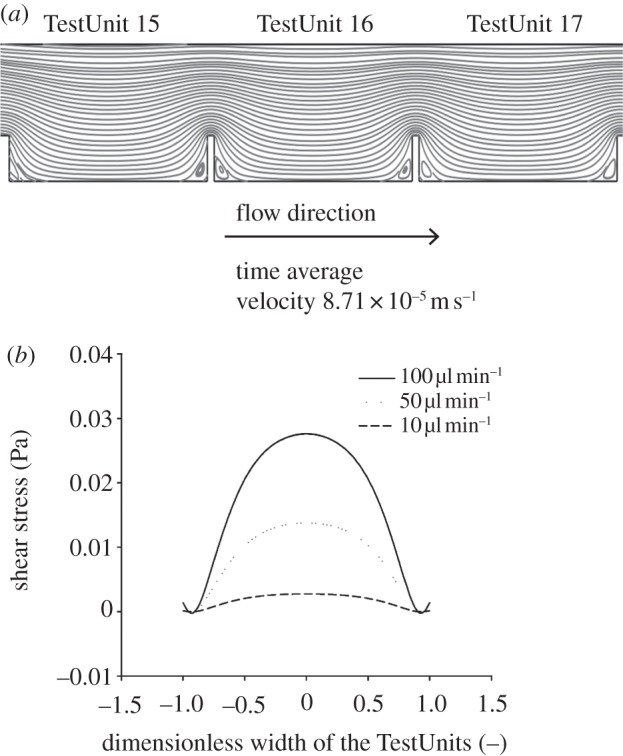
Figure 5.

Velocity and shear stress profiles of the chip. (a) Contour plot of the velocity profile developed in the chip for TestUnits 15–17 showing no turbulence, recirculation and eddies formation over the major part of the bottom of the compartments where cells are seeded. (b) Generic shear stress profile developed across the width of the compartments 10 µm above the bottom of the TestUnits for different fluid flow rates.
