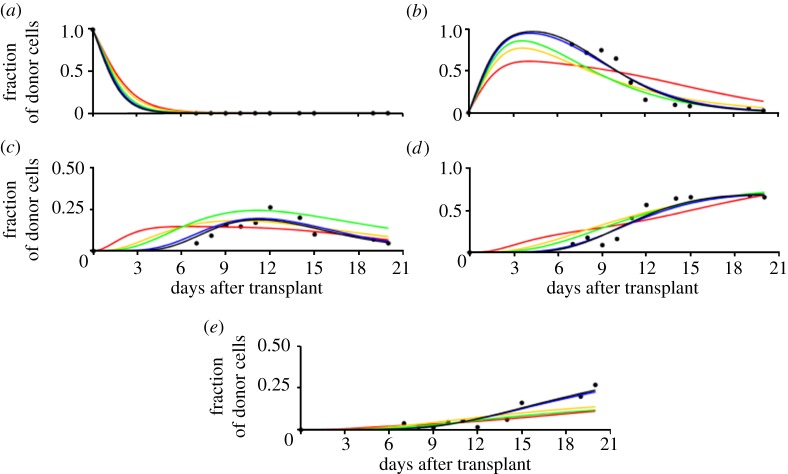
Figure 2.
Model predictions for (a) DN1pre, (b) DN1, (c) DN2, (d) DN3 and (e) pDP cells in constant (red, G = 11), linear (yellow, G = 12), semi-quadratic (green, G = 12), geometric (blue, G = 12) and ‘only last generation’ (black, G = 11) best models in terms of G, the number of generations. Data (black dots) adapted from [11].

