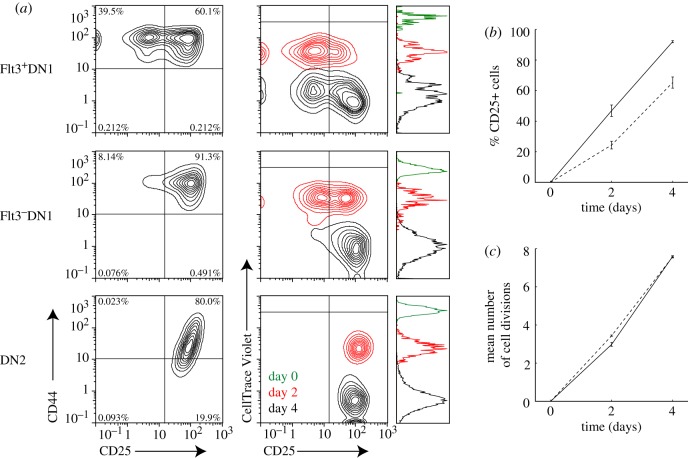
Figure 4.
Flt3+ DN1 thymocytes show a decreased probability of DN2 commitment per generation compared with Flt3− DN1 thymocytes. (a) Flow cytometry plots showing DN stage progression (CD44 versus CD25, top) and cell cycle progression (CellTrace Violet versus CD25, bottom) of Flt3+ DN1 (left), Flt3− DN1 (centre) or DN2 (right) thymocytes cultured on Op9-DL1 stromal cell layers for the indicated number of days. (b) Percentage of committed (CD25+) cells over time in Op9-DL1 culture of Flt3+ (dashed) or Flt3− (solid line) DN1 thymocytes. (c) Each time point represents mean and standard deviation of two to three experiments. Plot shows a decreased percentage of committed (CD25+) cells generated from Flt3+ DN1 thymocytes compared with Flt3− DN1 thymocytes. Mean number of cell divisions over time in Op9-DL1 culture of Flt3+ (dashed) and Flt3− (dotted) DN1 thymocytes. The mean number of cell divisions was given by the logarithm of the ratio of the initial to final mean fluorescence intensities of the CellTrace Violet-stained cell populations. Plot shows that Flt3+ and Flt3− DN1 cells divide at similar rates in Op9-DL1 culture so that DN2 commitment rates per generation are intrinsically different.

