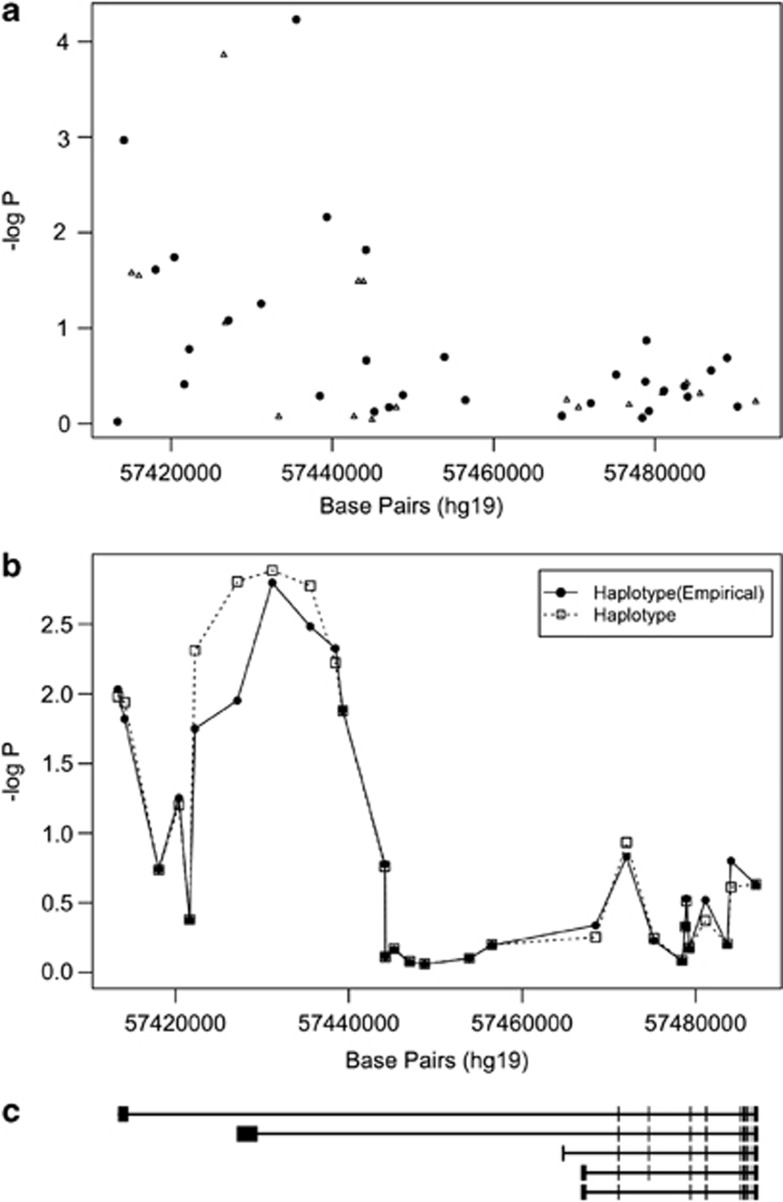
Figure 4.
GNAS association with bipolar disorder II (BPD II). The points in panel (a) represent genotyped. (black circles) and imputed (open triangles) single-nucleotide polymorphisms (SNPs) and their probability of association with BPD II. Panel (b) illustrates probability as a sequential sliding window with three SNPs per window for the genotyped SNPs (empirical haplotype) and all SNPs (haplotype). Panel (c) shows the structure of the GNAS gene aligned with panels (a) and (b) with exons represented by bars. The direction of transcription, 5′→3′ is from right to left in this figure.

