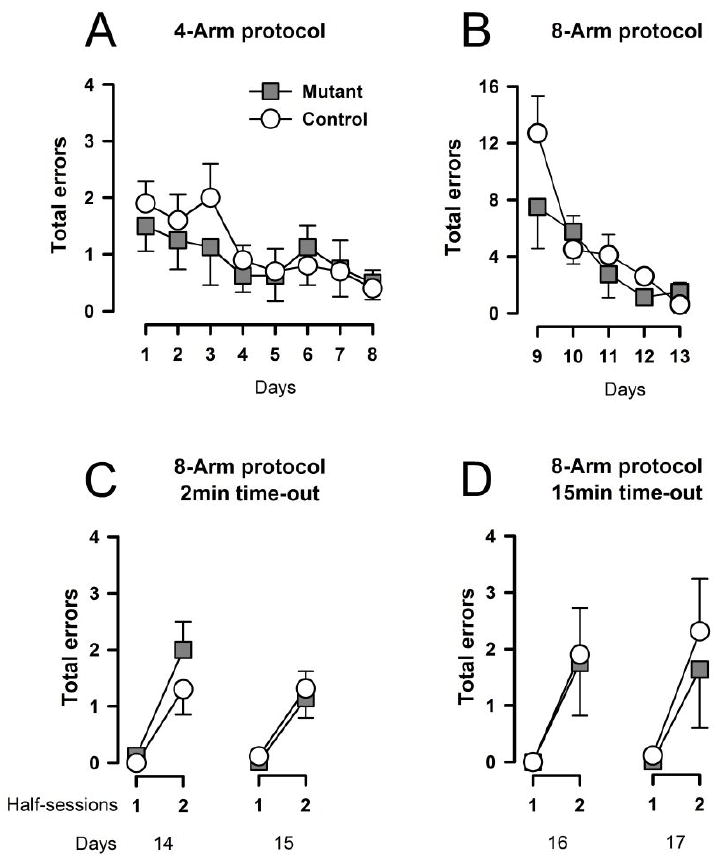
Figure 1.

Working memory performance on the Radial Arm Maze. The total number of errors (re-entry into a previously visited arm) is shown across days for both groups in the four arms and the eight arms configuration (A&B). There is a reduction of the total number of errors across days for both genotypes reflecting learning of the tasks and improvement of working memory performance. In (C&D), working memory performance on the eight arms baited configuration when a time-out is imposed after four collected rewards. For each delay is depicted the total number of errors per half-sessions on each day. In all the tasks (A, B, C & D) the mutation did not affect the performance. Error bars refer to ±SEM, mutant (n=8), control (n=10).
