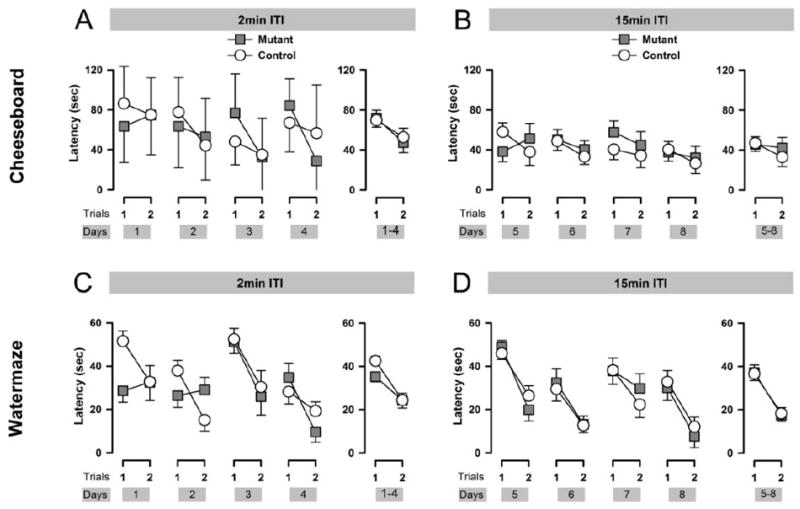
Figure 2.

Working memory performance was assessed in the cheeseboard and the watermaze. Performance in the working memory task in the cheeseboard maze indexed by latency to reach the reward location, across days at each trial is depicted in A when the ITI was 2min and B when the ITI was 15 min. Latency averaged across days as a function of trials are depicted at the right of each graphs A and B. The latency to reach the reward was significantly reduced from Trial 1 to Trial 2 when the delay was 2min, but failed to achieve significance when the delay was 15min. The performance never statistically differed between genotypes (A and B). Working memory performance in the water maze indexed by latency to reach the platform location, across days, for each trial is depicted in A when the ITI was 2min and B when the ITI was 15 min. The latency averaged across days as a function of trials is depicted for each ITI in the right of the graphs (C and D). In both delays, mice escaping performance statistically progressed from Trial 1 to Trial 2 without any differences between genotypes. Error bars refer to ±SEM.
